Reads approached the 2.5GbE link ceiling in the SSD array; writes were slower.
Test setup, measurements & limitations
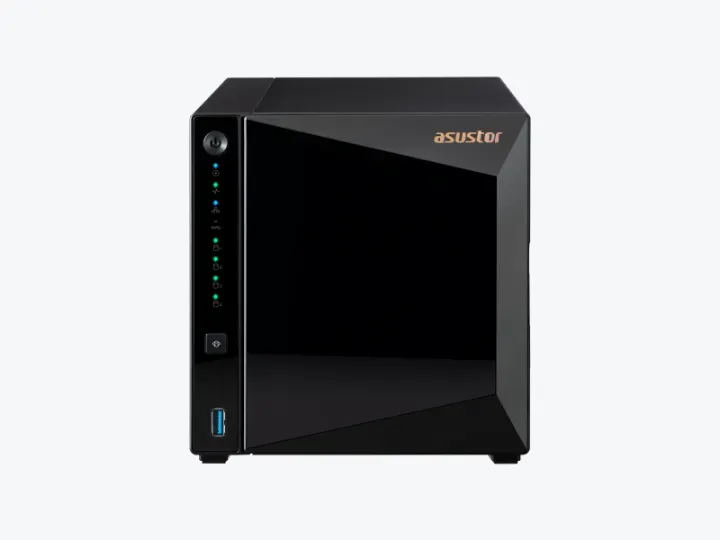
AS3304T v2 — TweakTown original review
Tested: Four Patriot P220 1TB SATA SSDs in RAID 5, confirmed by original drive photo and CDM label; single 2.5GbE link. CDM 8.0.5 x64, 3 runs, 1GiB, Y:4% (101/2848GiB). Exact client configuration and firmware build are not stated.
Applies to: Exact enclosure model; conclusions apply to the stated tested storage and network setup.
- Reads approached the 2.5GbE link ceiling in the SSD array; writes were slower.Source location: Testing / performance / setup section
Measurements reported by the reviewer| Measurement | Result | Conditions & source location |
|---|
| CDM SEQ1M Q8T1 read/write | 296.33 / 200.84 MB/s | Four P220 SATA SSDs, RAID 5; CDM8.0.5,3x1GiB,Y:4%.Original chart40 |
|---|
| CDM SEQ1M Q1T1 read/write | 222.56 / 184.86 MB/s | Four P220 SATA SSDs, RAID 5; CDM8.0.5,3x1GiB,Y:4%.Original chart40 |
|---|
| CDM RND4K Q32T1 read/write | 43.53 / 35.58 MB/s | Four P220 SATA SSDs, RAID 5; CDM8.0.5,3x1GiB,Y:4%.Original chart40 |
|---|
| CDM RND4K Q1T1 read/write | 9.47 / 8.42 MB/s | Four P220 SATA SSDs, RAID 5; CDM8.0.5,3x1GiB,Y:4%.Original chart40 |
|---|
| IOMeter4K random read | about13,000 IOPS at QD32 | Approximate visual reading of original red AS3304Tv2 bars; not exact data labels. SSD array, not HDD results.Original chart43 |
|---|
| IOMeter4K random write | about1,250 at QD1;3,100 at QD4;2,600 IOPS at QD128 | Approximate visual reading of original red AS3304Tv2 bars; not exact data labels. SSD array, not HDD results.Original chart44 |
|---|
| IOMeter128K sequential read | about100 MB/s at QD1;275 MB/s at QD4;around280 MB/s at higher queues | Approximate visual reading of original red AS3304Tv2 bars; not exact data labels. SSD array, not HDD results.Original chart45 |
|---|
| IOMeter128K sequential write | about80 MB/s at QD1;170 MB/s at QD4;around180 MB/s at higher queues | Approximate visual reading of original red AS3304Tv2 bars; not exact data labels. SSD array, not HDD results.Original chart46 |
|---|
| IOMeter8K70%read/30%write | about1,150 IOPS at QD1;3,050 at QD4;peak around3,300 at QD8 | Approximate visual reading of original red AS3304Tv2 bars; not exact data labels. SSD array, not HDD results.Original chart47 |
|---|
Limits to keep in mind
- SSD results are not estimates for a four-HDD array.
- One review sample is not long-term failure-rate evidence.
- Parent recovered original body and eight images after Grok fetches failed. Exact client configuration and firmware build remain unknown.
- Some prose summaries differ from charts: random writes are not flat at2500 IOPS;8K70/30 peaks aroundQD8 rather thanQD4. Chart estimates retained with approximate precision.
- No original power/noise/thermal measurements were found in this review.