Eight 18TB RAID6 drives delivered approximately 242/231 MB/s read/write in the chart. Typical-use power ranged from 54–60W to just above 90W; normal-use noise was 36 dBA against a 34 dBA room floor.
Test setup, measurements & limitations
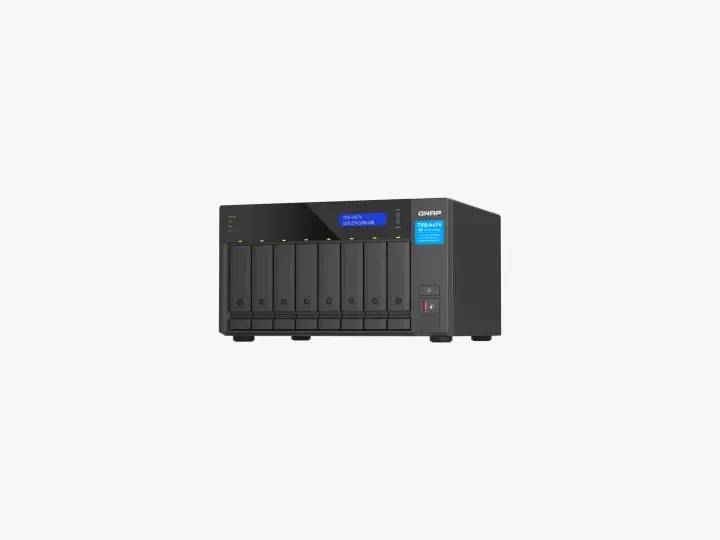
QNAP TVS-h874 Review: A Snappy ZFS NAS with 2.5GbE
Tested: TVS-h874-i5-32G, Core i5-12400, 2x16GB DDR4-3200, QuTS hero. SMB chart: eight 18TB drives in RAID6 (RAID-Z2), 2.5GbE. CPU benchmarks ran in a Linux container; screenshots identify Ubuntu 18.04.6 LTS.
Applies to: Exact factory i5/32GB. Chart identifies eight 18TB RAID6 drives and 2.5GbE; drive model, client and detailed workload are not published. An earlier hardware paragraph also mentions 14TB drives, without assigning them to this benchmark.
- The container CPU scores and responsive setup support application use alongside storage; they do not measure concurrent VM capacity.Source location: Page 3 management and performance
- The reviewer found drive access more audible than the fans in normal use. Heavy CPU work and add-in hardware can raise power and noise.Source location: Page 4 power and noise
Measurements reported by the reviewer| Measurement | Result | Conditions & source location |
|---|
| Geekbench 5.5.1 | 955 single-core; 5,669 multi-core | Linux x86 64-bit container, Ubuntu 18.04.6; not bare-metal desktopPage 3 Geekbench 5 screenshot |
|---|
| Geekbench 6.0.1 | 1,204 single-core; 5,844 multi-core | Linux AVX2 container, Ubuntu 18.04.6; different benchmark version from GB5Page 3 Geekbench 6 screenshot |
|---|
| SMB file server | Approximately 242 MB/s read; 231 MB/s write | Estimated from chart axis; eight 18TB drives RAID6 (RAID-Z2), single 2.5GbEPage 3 SMB chart |
|---|
| Typical-use power | 54–60W at the low end; just over 90W at the high end | Eight 18TB drives; not a maximum CPU/NVMe/NIC stress boundPage 4 power |
|---|
| Normal-use noise | 36 dBA with 34 dBA room floor | Meter, distance and detailed operating state not disclosed; HDD access louder than fansPage 4 noise |
|---|
Limits to keep in mind
- SMB graph is explicitly 2.5GbE despite the prose mentioning 10GBase-T; no separate 10GbE result is inferred.
- Throughput values are approximate chart readings; drive models, client and detailed test workload are unspecified.
- CPU benchmark screenshots are container tests; no maximum simultaneous VM count is established.
- Noise is environment-specific; no microphone distance or instrument is given.